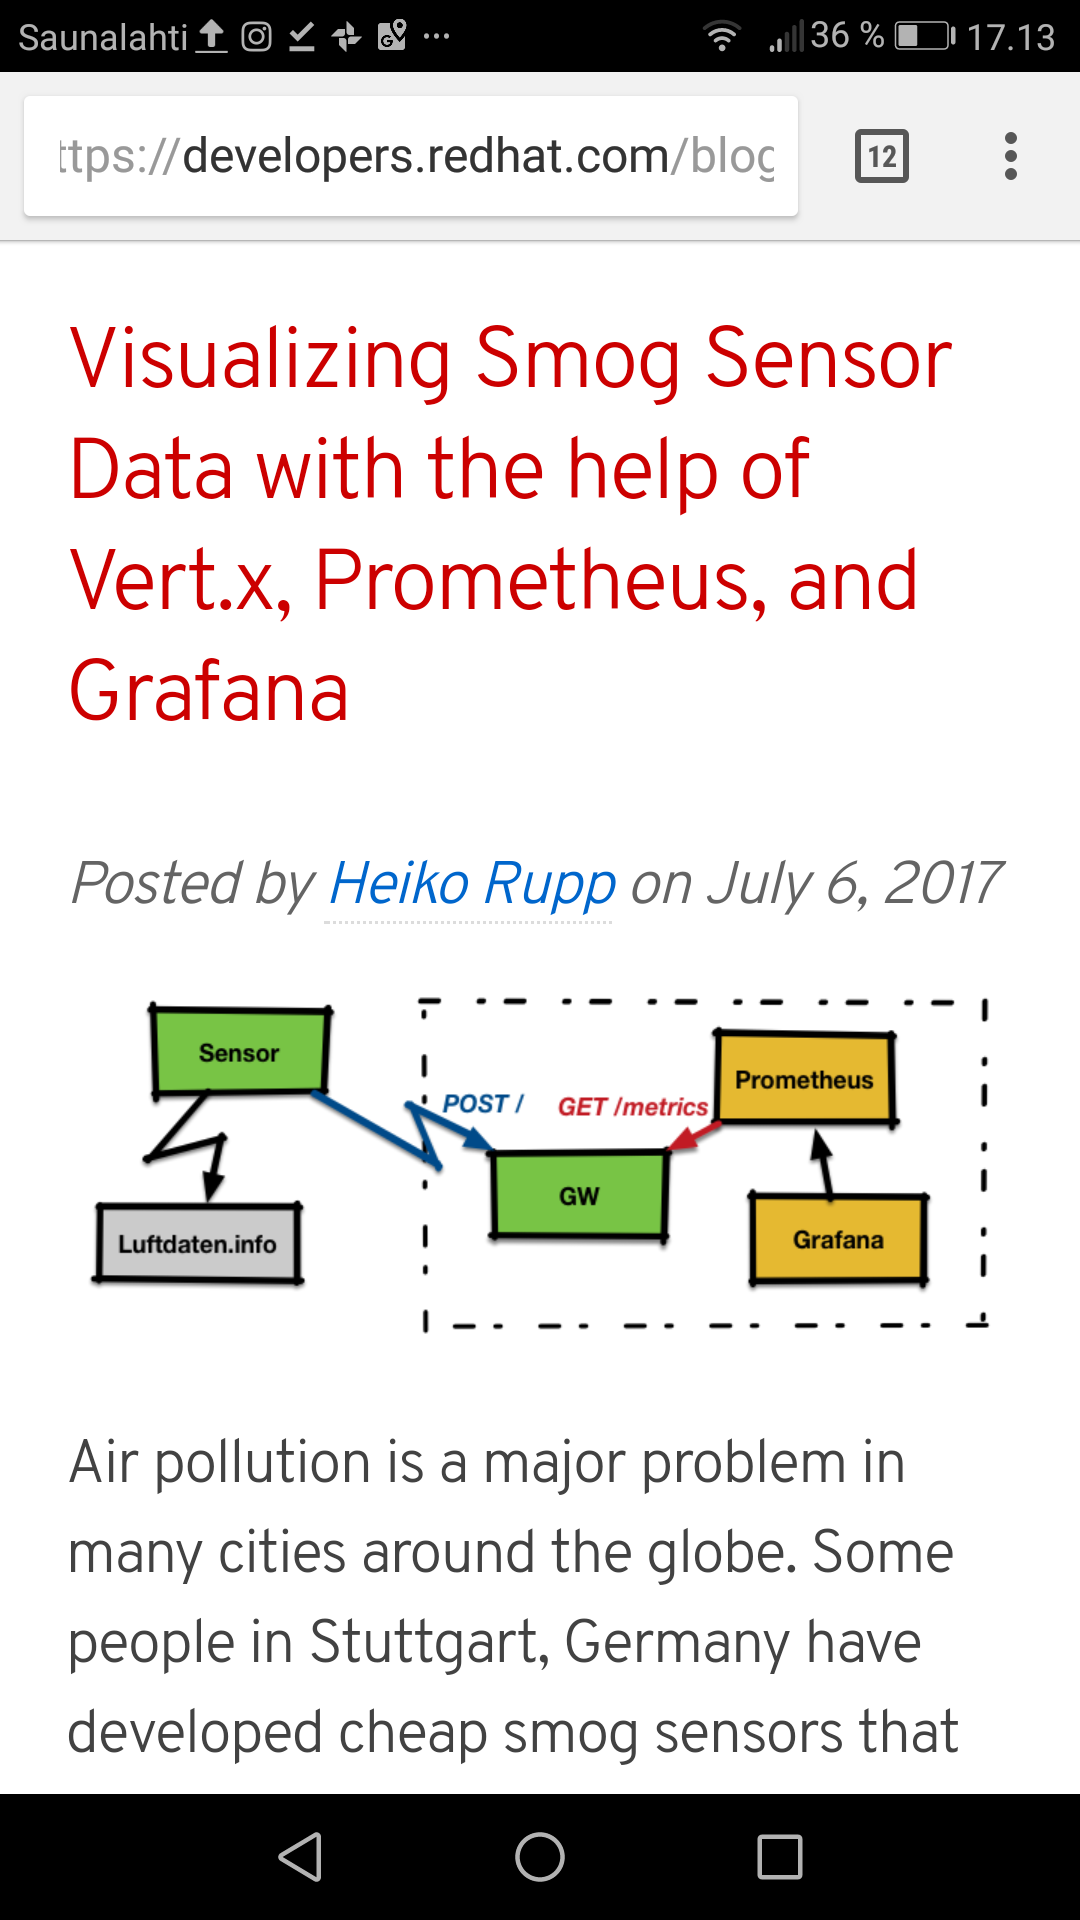
The article shows an end-to-end example of an IoT device sending data in a certain format. A gateway is implemented with the help of the Vert.x framework, which does all the magic of connection handling etc.
Finally, the data is stored in a Prometheus time series database and graphed via Grafana.

0 Comments
Be the first to post a comment.