TinySA is an amazing gizmo! I have already posted some video link on TinySA and here is some mode material on it. RF testing is getting quite popular these days, with many devices featuring wireless capabilities. However, RF test devices are quite expensive, or at least have been, as on few recent years many affordable RF test instruments have became available.
TINYSA IS A $49 SPECTRUM ANALYZER that I got from Banggood. The tinySA is a small spectrum analyzer, primarily intended for 0.1MHz to 350MHz input but can be used with higher frequencies up to 900 MHz.
The tinySA is a small spectrum analyzer having dual inputs. One of the input enables working frequencies over the MF/HF/VHF bands of 100KHz to 350MHz and the second input enables a lower quality frequency measurements over the UHF band of 240MHz to 960MHz. Really neat what could be done with the cheap SI4432 modules, the variety of cheap MCU’s,
The tinySA is aimed at radio amateurs, students, and electronic enthusiasts. The primary use is to measure the power of the spectrum of known and unknown signals. Spectrum analyzers are widely used to measure the frequency response, noise and distortion characteristics of all kinds of radio-frequency (RF) circuitry.
Spectrum Analyzer with two inputs, high quality MF/HF/VHF input for 0.1MHZ-350MHz, lesser quality UHF input for 240MHz-960MHz.
Switchable resolution bandpass filters for both ranges between 2.6kHz and 640kHz
Color display showing 290 scan points covering up to the full low or high frequency range.
Input Step attenuator from 0dB to 31dB for the MF/HF/VHF input.
When not used as Spectrum Analyzer it can be used as Signal Generator, MF/HF/VHF sinus output between 0.1MHZ-350MHz, UHF square wave output between 240MHz-960MHz.
A built-in calibration signal generator that is used for automatic self test and low input calibration.
Connected to a PC via USB it becomes a PC controlled Spectrum Analyzer
Rechargeable battery allowing a minimum of at least 2 hours portable use
Due to the low cost and very small form factor there are certain relevant limitations.
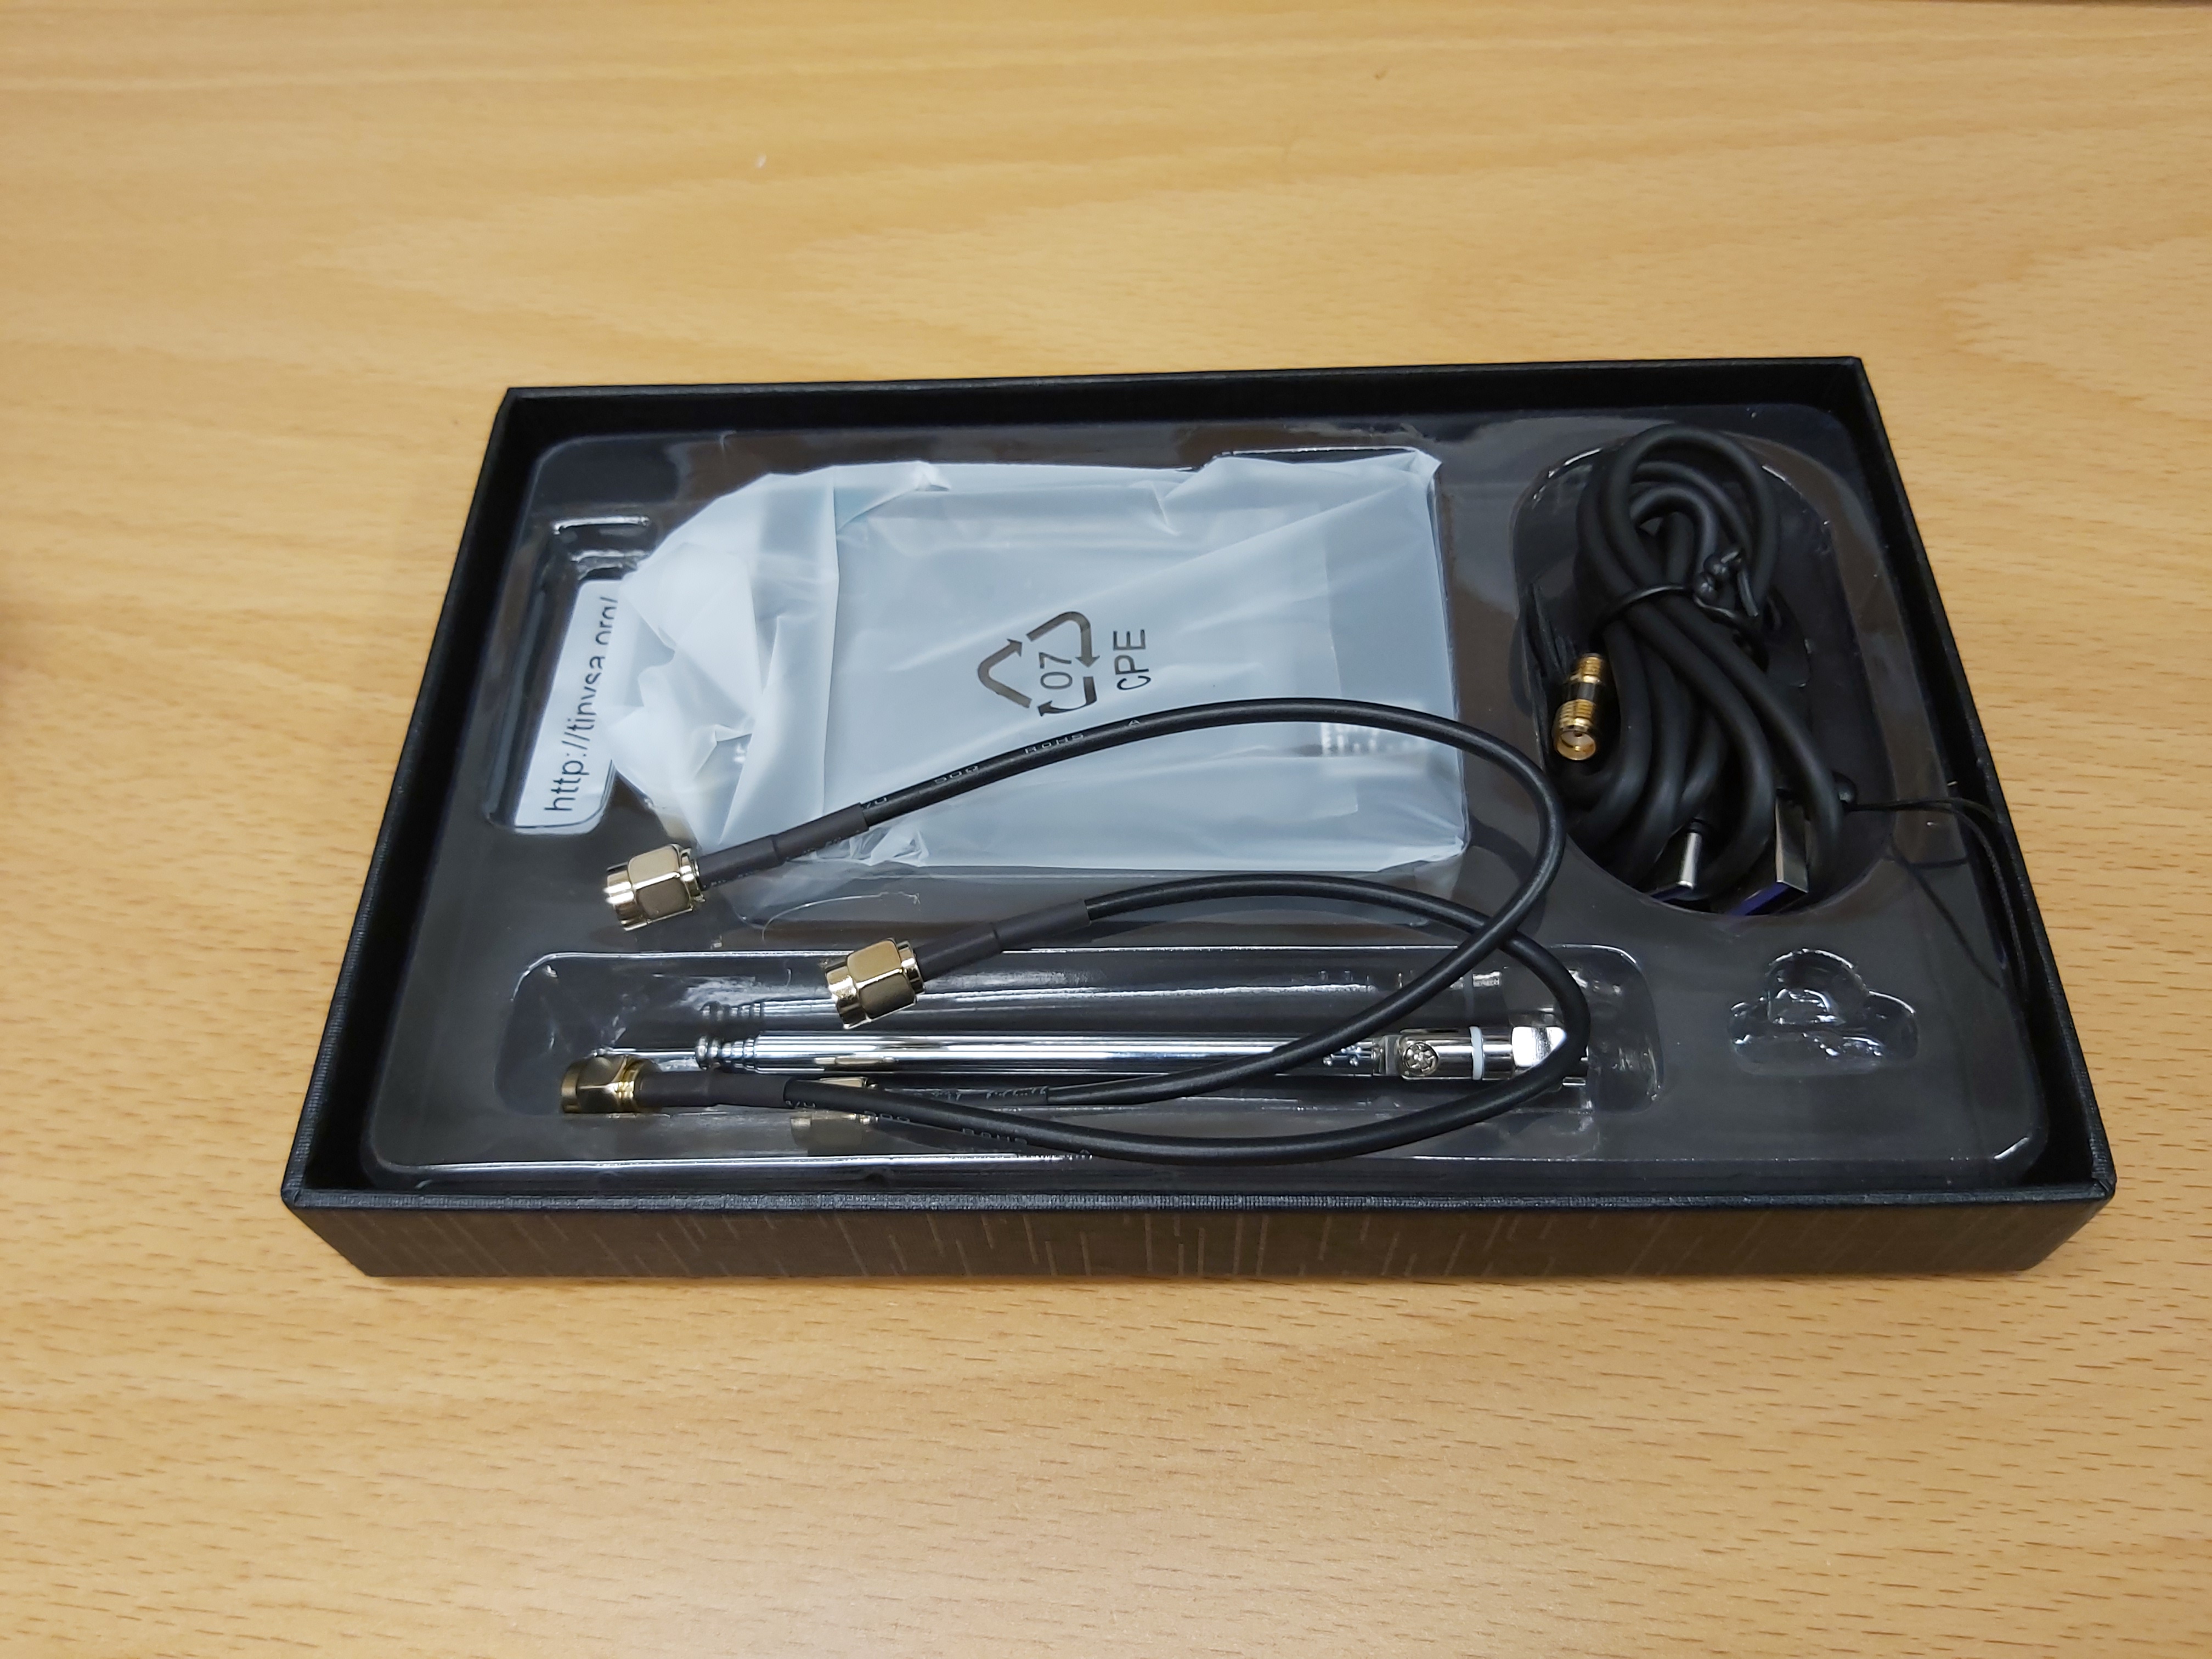
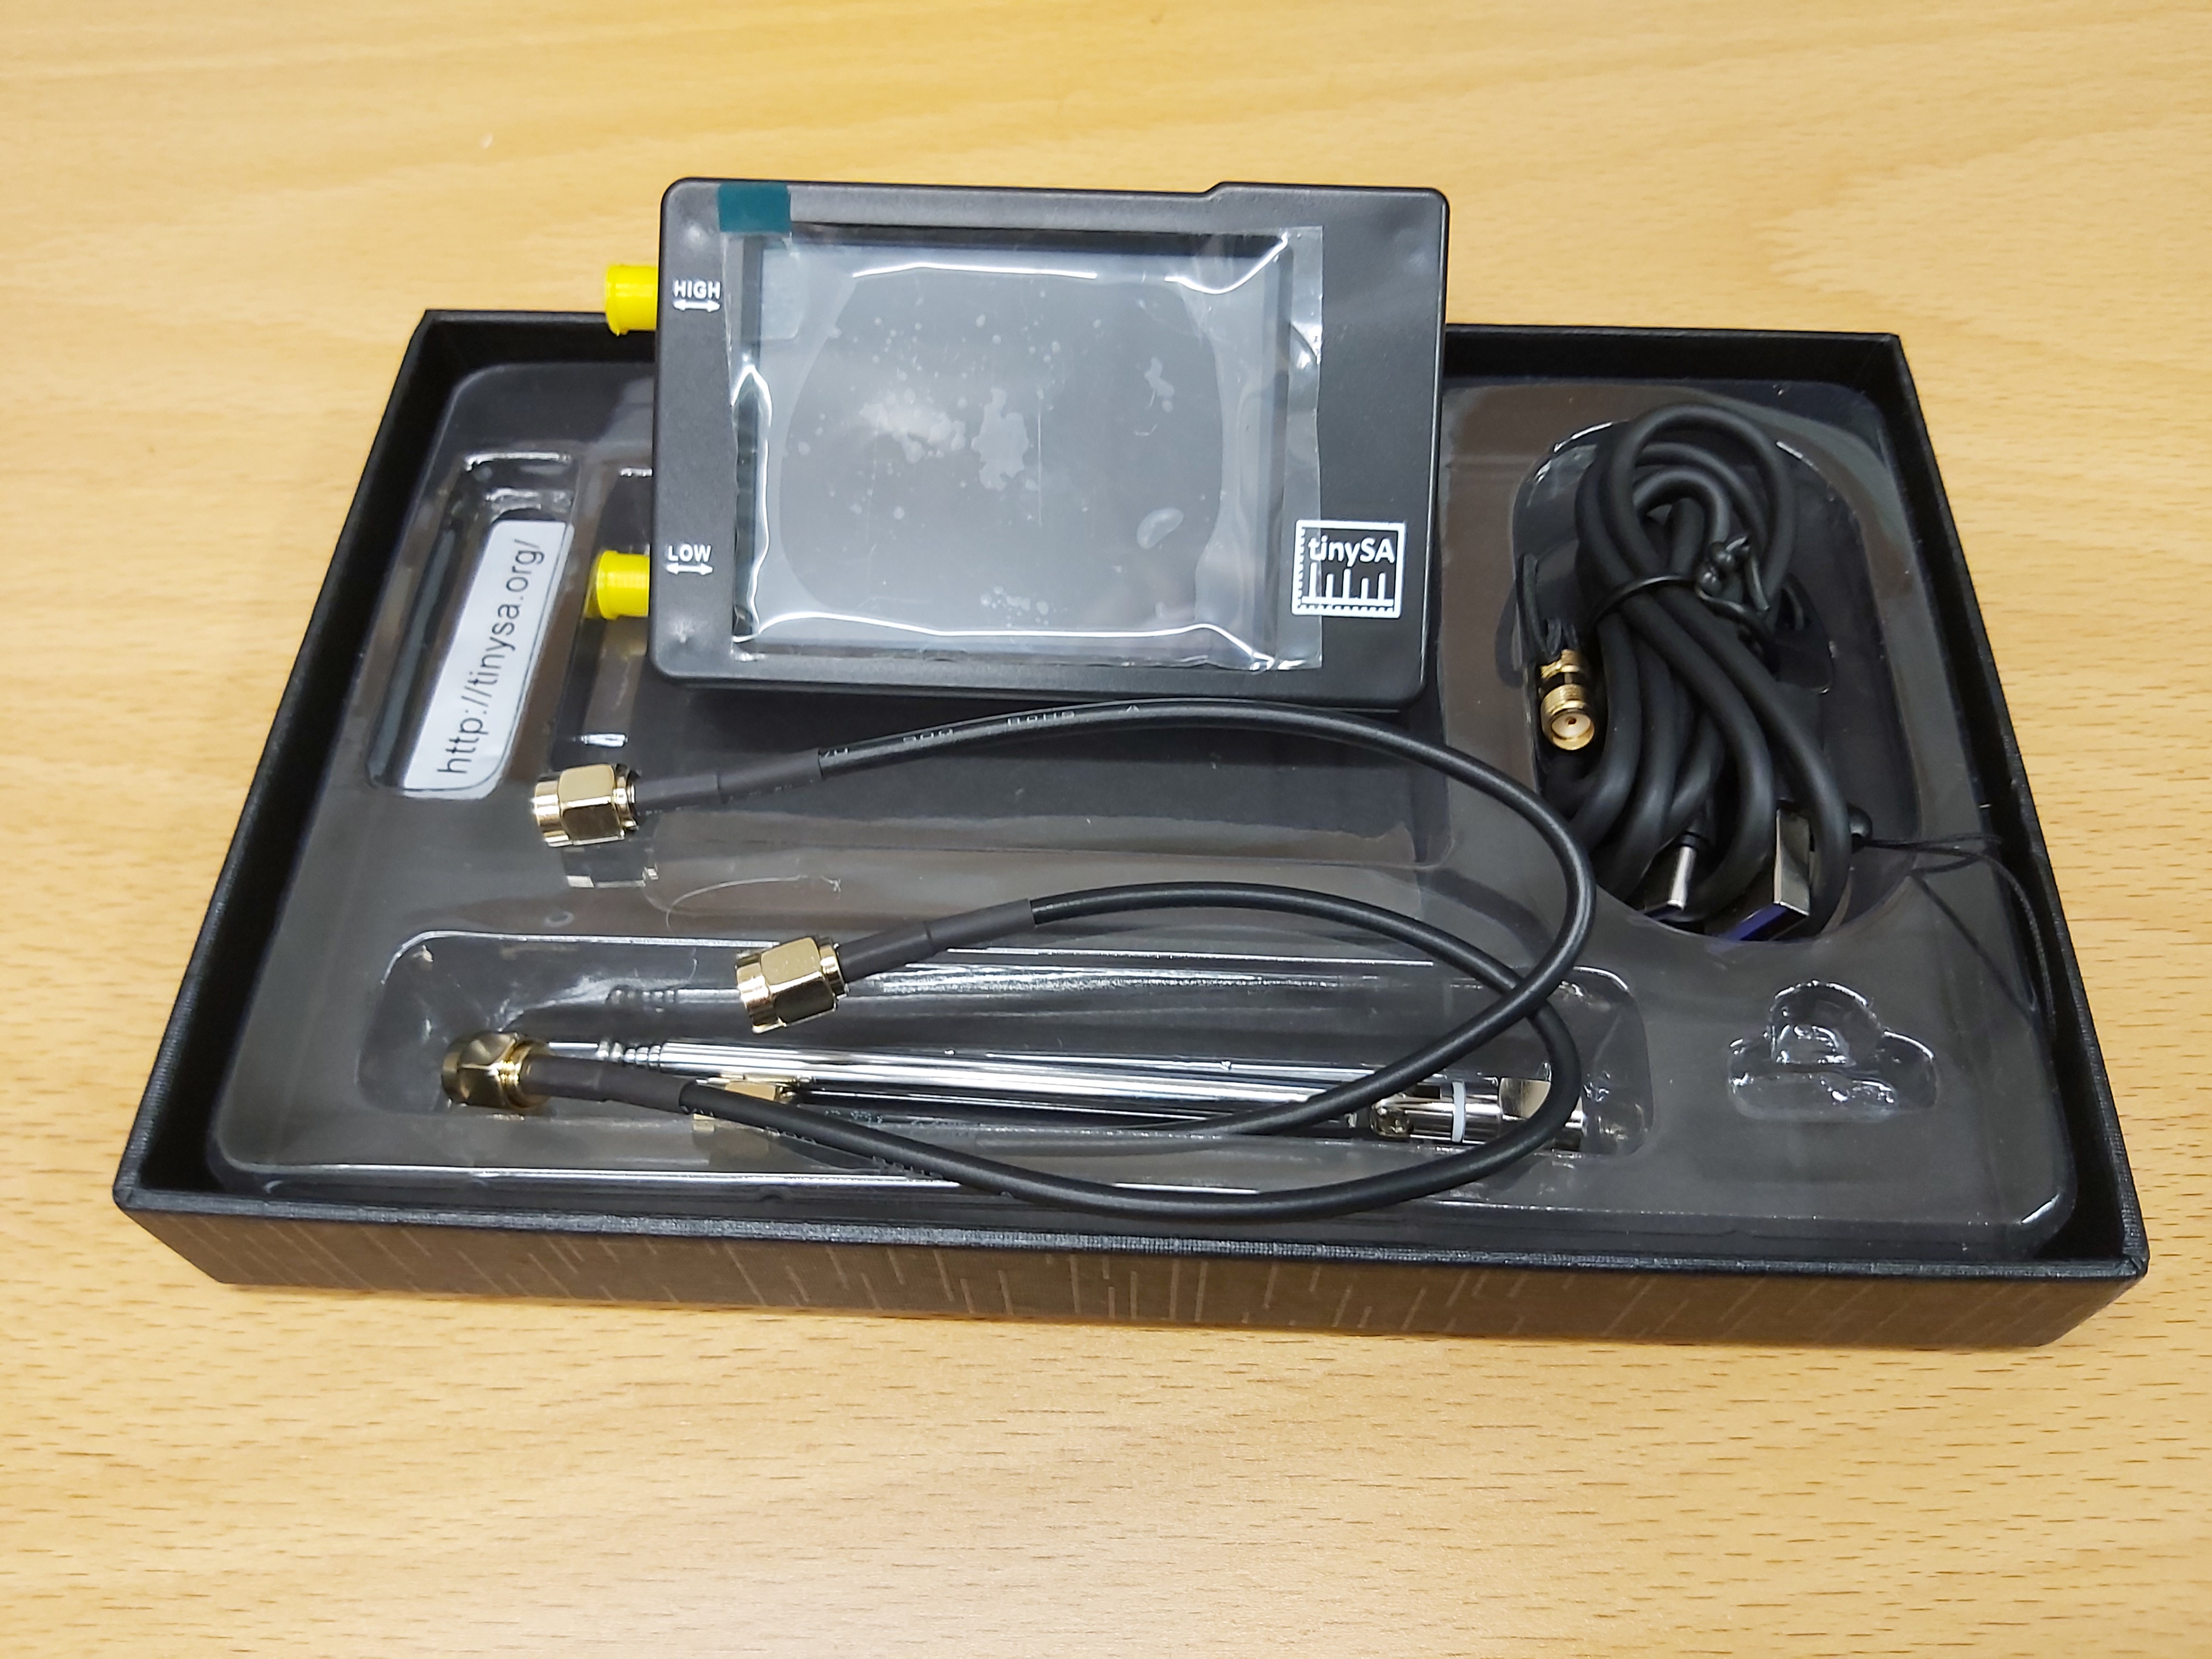
The product comes in quite nice looking box that contains pretty much everything needed to get started to use the device:
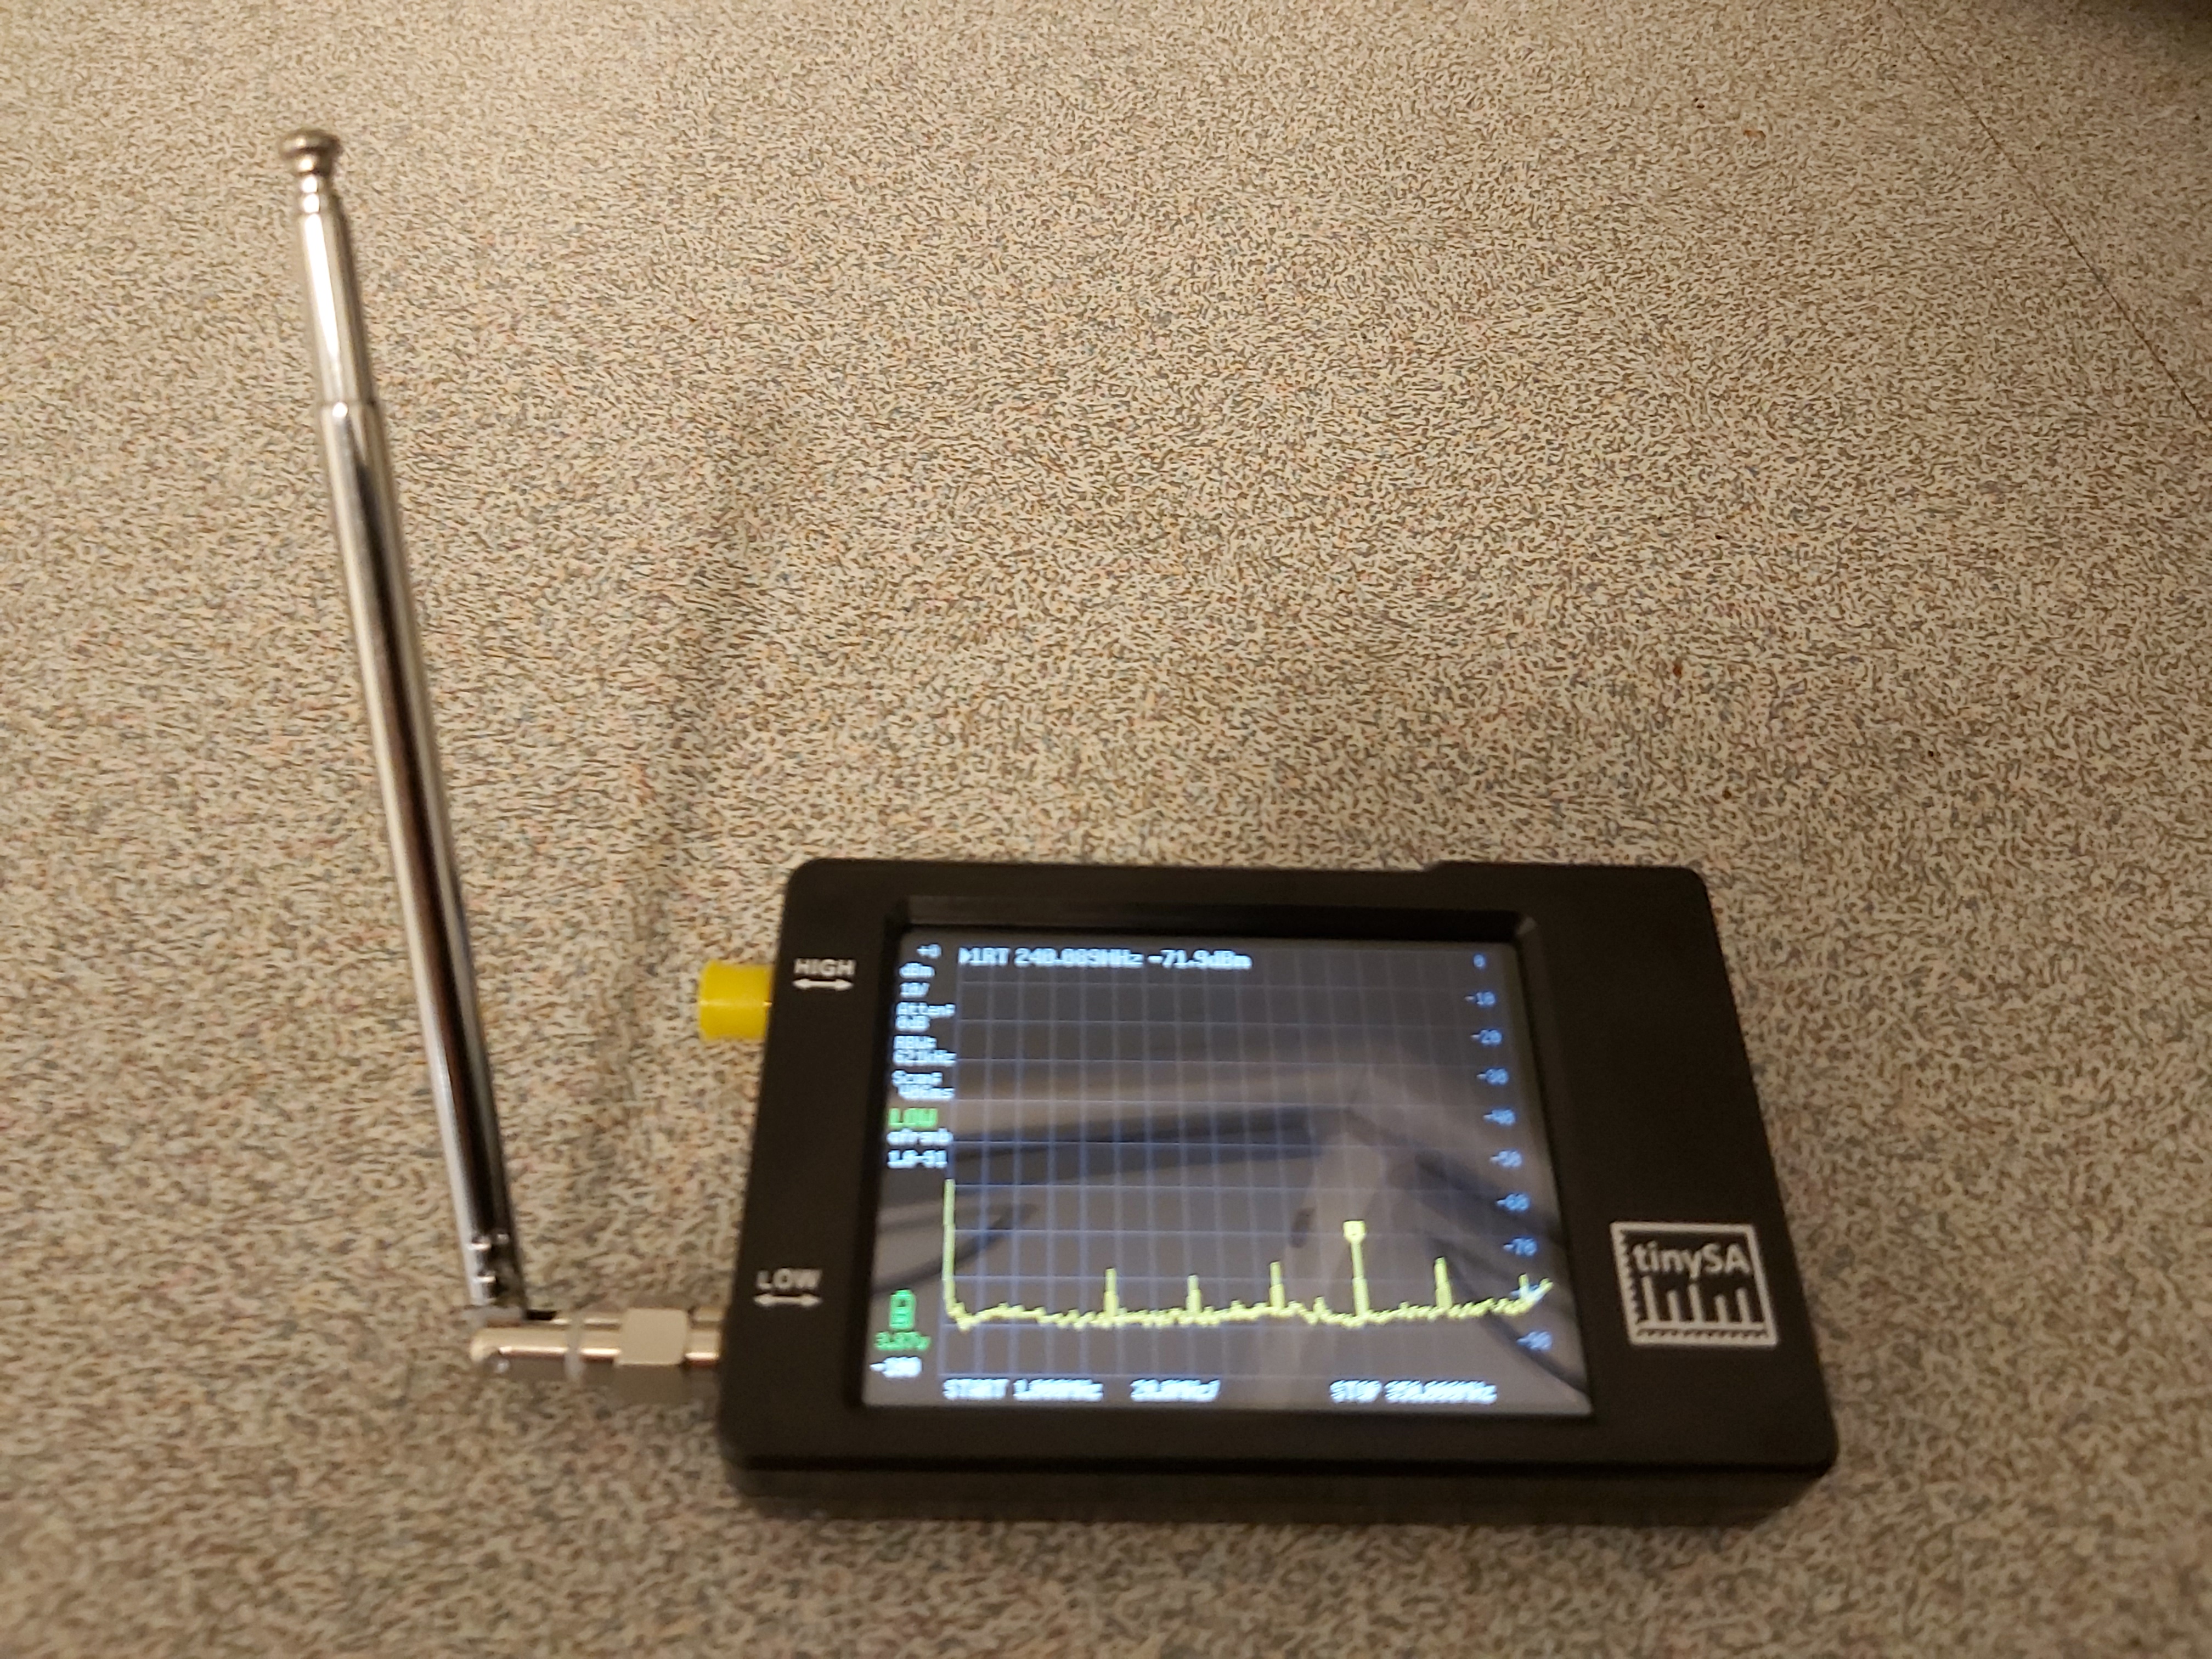
The device is ready to be tested when you take the tinySA and antenna from the box.
Testing to see the radio signals around me.
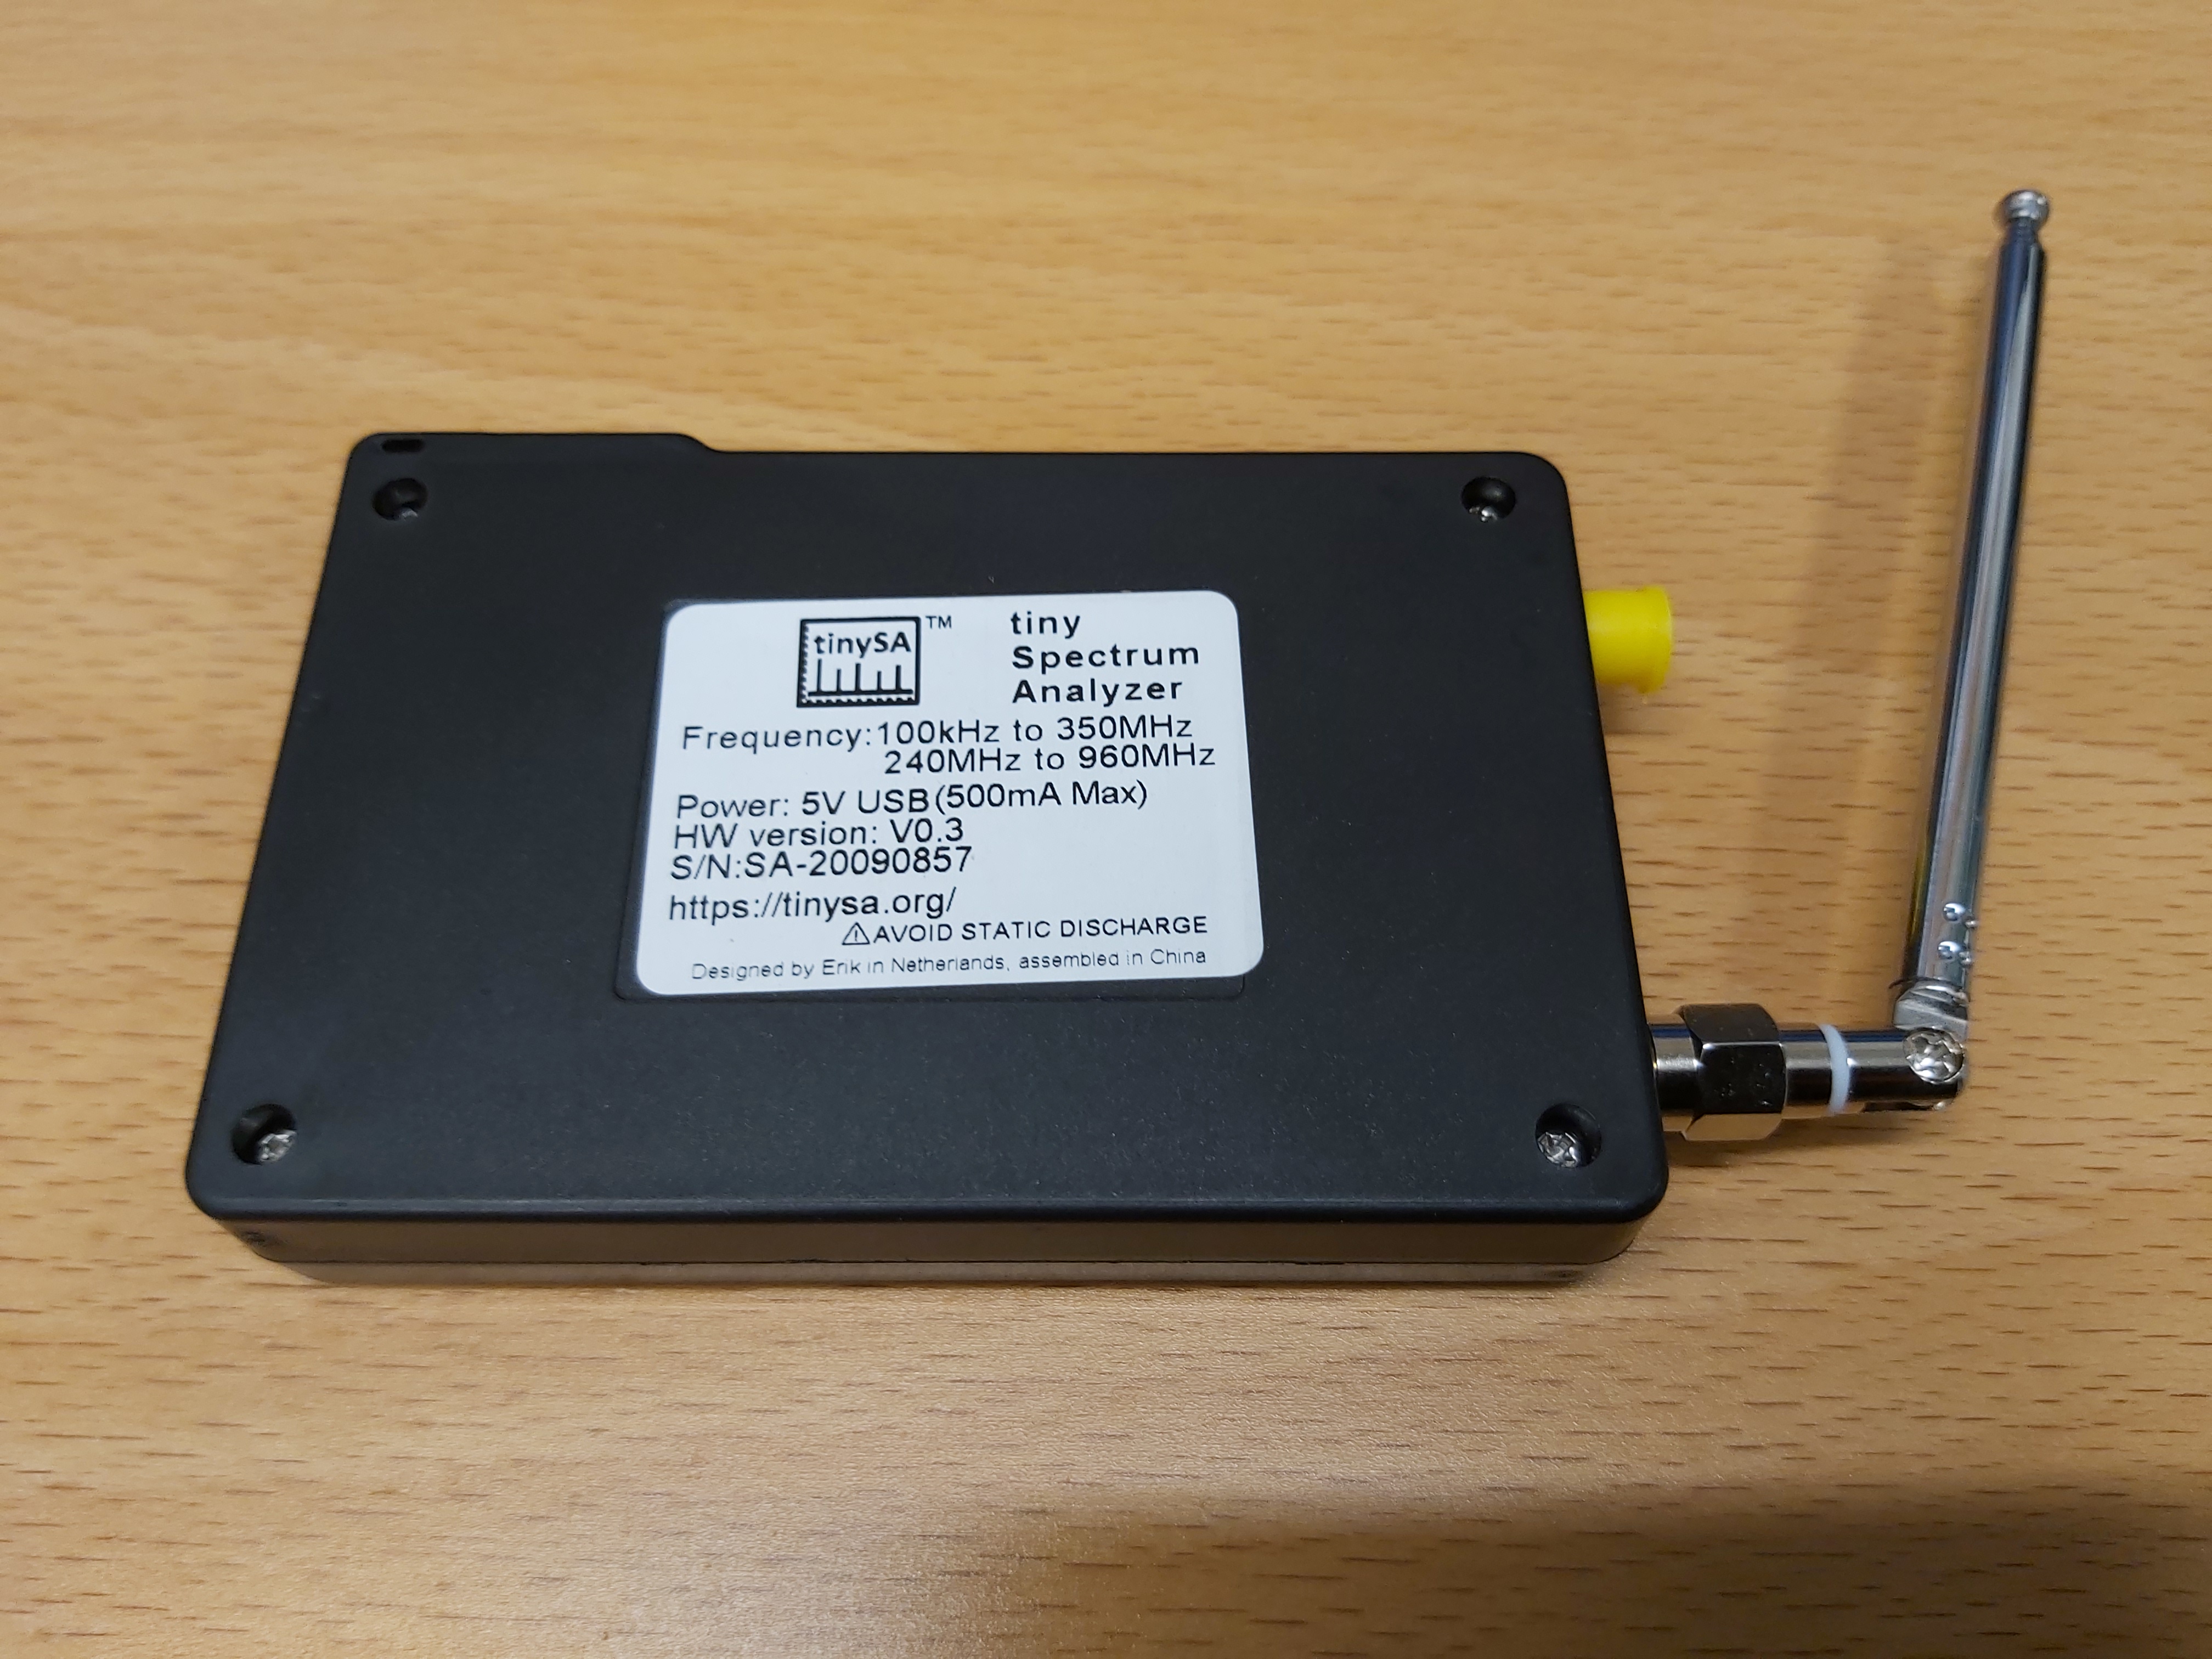
Device information from the back of the tinySA.
The tinySA also features a 2.8” color display screen showing 290 scan points covering up to the full low or high-frequency range. It Input Step attenuator can be set from 0dB to 31dB for the MF/HF/VHF input, but the UHF input cannot exceed 10dBm. TinySA has a switchable resolution bandpass filters between 2.6kHz and 640kHz. The tinySA can be connected to a PC via USB it becomes a PC controlled Spectrum Analyzer. You can view the tinySA output on your PC if you use tinySA-saver (multi-platform) or the tinySA PC software (only runs on Windows). . Rechargeable battery allows a minimum of at least 2 hours portable use.
The tinySA also features a built-in calibration signal generator that is used for automatic self-test and low input calibration. When not used as Spectrum Analyzer it can be used as Signal Generator, MF/HF/VHF sinus output between 0.1MHZ-350MHz, UHF square wave output between 240MHz-960MHz. Signal Generator offers MF/HF/VHF sinus output between 0.1MHZ-350MHz, it can output a sinusoid with harmonics lower than -40dB of fundamental at an output point that is pickable in 1 dB steps between -76dBm and -6dBm. It also features an optional AM and FM module or a moderate brush over the selective frequency range (UHF square wave output between 240MHz-960MHz).
There are many features in tinySA, but there are also some limitations. Due to the low cost and very small form factor there are certain relevant limitations. As the internal components of the tinySA where selected with a careful balance between performance and cost there are certain limitations that experienced users of much more expensive spectrum analyzers must be aware of:
The internal phase noise sets a clear lower limit for phase noise measurements.
The minimum resolution bandwidth of 2.4kHz makes it impossible to see more spectral detail
The high input (240MHz to 960MHz) has very limited image suppression and only one level optional built in attenuator which makes it difficult to interpret complex signals.
The high input optional input attenuator is frequency dependent and varies between 25dB and 40dB
At lower resolution bandwidths (below 30kHz) the measurement time per point starts to increase due to the resolution filter implementation. Careful use of the FAST sweeping mode may reduce this time increase
The performance limitations of the shielding and the filters may lead to certain images and spurs being visible but certain functions like spur suppression and switching to below IF may help detect and/or reduce these spurs and images
Below 0.1MHz the sensitivity starts to reduce.
Below 1MHz it is recommended to disable the AGC and possibly enable the LNA to get best measurement quality
When using the supplied telescopic antenna or a low RBW one should be aware of the radiation from the tinySA MCU on 48MHz and its harmonics
There is currently no clone of tinySA. All are genuine and manufactured by Huyen.
#535b TinySA Tiny Spectrum Analyzer for $49
tinySA Spectrum Analyzer review (Banggood)
Excellent work, it’s amazing that so much functionality can be brought into such a small unit and at such a low cost. This will be a very useful piece of test equipment.
TinySA works as pretty nice spectrum analyzer. Like any spectrum analyzer, it is possible – easy, even – to overload the front end and generate harmonics and spurs. If you are aware of the tinySA’s limitations, it works surprisingly well. If you can keep signals below -35 dBm and most of spurs disappear. The issue in keeping signal levels low is that -35 dBm is pretty low so thiscuts way into the usable dynamic range. The TinySA doesn’t have a front end tracking filter, so strong out of band signals can cause problems. The attenuator helps. Nobody expects a low NF for a spectrum analyzer, so that’s not a big deal.
How tinySA compares to NanoVNA? They are different things designed for different tasks although they have quite similar looking form factors. While there are similarities, the tinySA is NOT NanoVNA hardware. The NanoVNA is a VNA, for measuring S-parameters for reflection, transmission, and impedance properties of a system. You might use it to measure SWR, filter frequency response, transmission line velocity factor, input impedance, etc. A spectrum analyzer measures the frequency content of rf signals into its port. It’s good to testing things like harmonic suppression, spectral purity, intermodulation, etc. The hardware on tinySA is in many ways different from NanoVNA. What differentiates TinySA from Nano VNA is the TinySA includes switchable input attenuators. To get the best measurement performance, it is important to pre-scale the input signal to the level where the detector has its best trade-off of linearity and sensitivity. There are also other Spectrum Analyzer factors such as resolution bandwidth, IF bandwidth and type of detector (peak/average/log/minimum) that are not as important considerations to a vector network analyzer that is generating its own controlled stimulus signal. IMSAI Guy did a video teardown so you can see that it is not the same as the NanoVNA design at all. TinySA – Spectrum analyzer with tracking generator (Reincarnation of nanoVNA) is develeperd by hugen79 (of NanoVNA-H, -H4, v2.2N) and Erik Kaashoek. TinySA uses different analog hardware for the Spectrum Analyzer and Signal Generator functions. Same screen and case. Some of the NanoVNA code has been used for the screen and user interface. There was an attempt to write different firmware to turn the NanoVNA into a Spectrum Analyzer but the analog hardware is just not suitable.
If you are doing RF experimenting it might be a good idea to have both gadgets. By having both tinySA and the NanoVNA (which can also work as a signal generator) you’ve basically got $100-120 to get the RF equivalent of a DMM.
“How does it compare to the RTL-SDR?” Apples to oranges. The tinySA is a spectrum analyzer. The RTL-SDR is a receiver. tinySA offers significantly better bandwidth and a lower noise floor ~100dB for the frequency range spec. Works well below -30dB so consider using with attenuation or signals of interest. tinySA offers small and stand alone operation. RTL-SDR needs to have a computer and has ~-70db noise floor, has more limited dynamic range and slow frequency scanning. On the other hand, the RTL-SDR gives you real time I and Q samples at 2 megasample/sec or more over USB, making it a very flexible receiver when used with a computer. You can build almost arbitrarily complex virtual receivers the GNU Radio software and an RTL-SDR. One of the bigger problems with the RTL-SDR is that there are no pre-selector filters, making it susceptible to overload and intermodulation of out-of-band signals with the signal you want. The RTL-SDR is OK but not great for 1.0 MHz – 30 MHz.
For more information:
HUGEN LAUNCHES PORTABLE TINYSA SPECTRUM ANALYSER
TinySa article is in 3 languages: English, Danish and German
TinySA spectrum analyzer 0.1MHz to 350MHz video and videos noting how to use for better performance
The tinySA firmware code is available on github because parts of it are based on open source NanoVNA (and other) code, it had to be open source: https://github.com/erikkaashoek/tinySA
https://hackaday.com/2020/09/01/tinysa-is-a-49-spectrum-analyzer/
How to Test EMP Proof Container with tinySA. Let’s Test The Tactical Trash CanErik Kaashoek Youtube with new tinySA videos
TinySA spectrum analyzer 0.1MHz to 350MHz
48 Comments
Tomi Engdahl says:
tinySA: Finding Interference and Aiming Antennas
The latest RF equipment for your field backpack
https://www.tvtechnology.com/opinion/tinysa-finding-interference-and-aiming-antennas
Tomi Engdahl says:
EMC Lähikentän mittapäät
https://iosignal.fi/shop/emc/emc-probes/tekbox-tbps01/
EEVblog #1178 – Build a $10 DIY EMC Probe
https://www.youtube.com/watch?v=2xy3Hm1_ZqI
Tomi Engdahl says:
#234: Basics of Near Field RF Probes | E-Field & H-Field | How-to use
https://www.youtube.com/watch?v=ctynv2klT6Q
Tomi Engdahl says:
tinySA quick comparison of clone vs genuine
https://m.youtube.com/watch?v=I5IzLAGgKg0&feature=youtu.be
this short video a quick comparison is done of a clone versus a genuine tinySA. Focus is on some of the differences that will impact your measurements. The comparison is by no means trying to be exhaustive.
For more info on the tinySA visit: https://www.tinysa.org/wiki/
Tomi Engdahl says:
https://www.facebook.com/groups/368777730463838/permalink/752828302058777/
I used tinySA to locate and aim my UHF attic for a difficult station. It worked work well for the purpose with some precautions and was far easier to use in the attic, so I created a tutorial. My tinySA’s factory calibration on the HIGH input was dead-on on the bench and its results on the antenna signals similar to those on my Tektronix 2754P at the other end of the feedline, allowing for the line loss. At 54 lbs, that monster wasn’t going to make it into my attic.
https://m.youtube.com/watch?v=T8HDpqwo-0Y&feature=youtu.be
Tomi Engdahl says:
TinySA Tinkerin’
https://www.youtube.com/watch?v=AkZQ-URnBCs
Just picked up a TinySA spectrum analyzer and used it to check the output from an inexpensive HF signal generator. The TinySa, generator, and a set of external attenuators can combine to satisfy a lot of HF needs.
The strange thing here is the 0-81 dB step attenuators I am using are way more valuable than the signal generator and the TinySA put together – by far!
Also notice how a strong second harmonic is always present as the frequency of the generator changes.
Tomi Engdahl says:
tinySA internals: AGC and LNA
https://www.youtube.com/watch?v=aE1e18eAL2I
In this video the inner working of the AGC and LNA are demonstrated and two special cases are shown where the control SW enables additional setting optimizations.
tinySA settings impacting scanning speed
https://www.youtube.com/watch?v=AfVv0w6oiDA
The tinySA has various settings to optimize scanning speed. A number of these settings are explained and demonstrated.
Tomi Engdahl says:
NanoVNA and TinySA for Radio Design
https://www.youtube.com/watch?v=B7DFOq9rM_M
Using the NanoVNA and TinySA to illustrate how radio / wireless devices work. This video concentrates on showing the front-end filtering and amplification in a superhet FM broadcast band receiver design. It also overviews some key instruments that have become reasonably affordable in recent years, allowing a home RF lab to be assembled for a few hundred dollars.
Tomi Engdahl says:
Absolute maximum input level of +10dBm with 0dB internal attenuation
Absolute maximum short term peak input power of +20dBm with 30dB internal attenuation
Suggested maximum input power of +5dBm with internal attenuation in automatic mode
https://tinysa.org/wiki/pmwiki.php?n=Main.Specification
Tomi Engdahl says:
tinySA versus Siglent SSA3021X+
https://m.youtube.com/watch?v=YJ1pN0RuXcg&feature=youtu.be
A direct comparison of a tinySA and a Siglent SSA3021X+ while measuring signal levels and harmonics. Various aspects of level measurements are explained and demonstrated
For more info on the tinySA go to https://tinysa.org/wiki/
Tomi Engdahl says:
https://www.youtube.com/watch?v=nn14JNxNT1Y
Tomi Engdahl says:
Banggood has removed almost all references to the tinySA trademark and is now only selling clones
Says https://tinysa.org/wiki/pmwiki.php?n=Main.Buying
Tomi Engdahl says:
The cloners use a patched firmware to prevent failing of the selftest. After upgrading the firmware you may get failures in the selftest but the selftest is based on possible component variations after full validation in manufacturing, which is not guaranteed with a clone.
https://tinysa.org/wiki/pmwiki.php?n=Main.Buying
Tomi Engdahl says:
tinySA observing Cable signals
https://m.youtube.com/watch?v=Vn2da_UBuBE&feature=share
SA short video demonstrating the tinySA observing some cable signals and using the cable signal to do a power level calibration of the high input.
Tomi Engdahl says:
Feature update september 2021
https://m.youtube.com/watch?v=-FIFO5vgGk0&feature=share
This video demonstrates some of the new features in the V1.3317 firmware update.
Most important change is the new TRACE menu allowing full flexibility on how to use the three available traces.
An advanced feature demonstrated is how to compensate frequency dependent gain of an amplifier or antenna using a stored trace defined by a table modeling the main versus frequency
Tomi Engdahl says:
tinySA versus Siglent SSA3021X+
https://m.youtube.com/watch?v=YJ1pN0RuXcg&feature=share
A direct comparison of a tinySA and a Siglent SSA3021X+ while measuring signal levels and harmonics. Various aspects of level measurements are explained and demonstrated
For more info on the tinySA go to https://tinysa.org/wiki/
Tomi Engdahl says:
This video shows how to use the pulse output of a NEO-7M to correct a small frequency error of the TCXO of the tinySA. No additional equipment is needed.
https://m.youtube.com/watch?v=5dHFF03mupI&feature=share
Tomi Engdahl says:
tinySA and NanoVNA measuring each other
https://m.youtube.com/watch?v=anG7APSxI9M&feature=share
A short video showing the tinySA and the NanoVNA measuring each other
For more information go to http://tinysa.org
ADEFELA ADEKUNLE says:
Please how do i know the gain of the tinySA interm of the antenna and the device itself
ADEFELA ADEKUNLE says:
how do i know the gain of a tinySA in term of its antenna and the device itself
Tomi Engdahl says:
The next generation of the tinySA has been announced by the developer, Erik Kaashoek. It is called the tinySA Ultra and has a 4″ screen, higher frequency capability and many new features. Here is a link to a video describing the product. In production now and shipping soon.
https://m.youtube.com/watch?v=xFD34qUc2PA
Tomi Engdahl says:
A short introduction to the new 4 inch display tinySA Ultra
Main differences with the 2.8 inch display tinySA are:
- Built-in LNA
- Resolution filters from 200Hz to 850kHz
- No separate high mode but continuous scanning up to 800MHz or, with Ultra mode enabled, to above 6GHz
- Standard SD card slot and headphone output
Also the signal generator has more options, both in modulation and output frequencies.
For more info on the tinySA visit http://tinysa.org
Tomi Engdahl says:
tinySA Mistakes
https://m.youtube.com/watch?v=E2bxZZXyVoE&pp=QAFIAQ%3D%3D#bottom-sheet
This video demonstrates some mistakes you can make when doing measurements with the tinySA and, where possible, explains how to prevent them.
For more information on the tinySA go to: https://tinysa.org
Tomi Engdahl says:
tinySA Ultra has a built-in LNA and can do resolution bandwidth down to 200 Hz. This combination permits observing signals down to -130 dBm! Short video for those interested.
https://m.youtube.com/watch?v=iOOeNR_GN88
Tomi Engdahl says:
https://www.tinysa.org/wiki/
Tomi Engdahl says:
https://m.alibaba.com/product/1600085564565/Erik-Hugen-Zeenko-Hand-held-tiny.html
Tomi Engdahl says:
tinySA Ultra Signal Generator functionality
https://www.youtube.com/watch?v=U2cw0bmuSLM
This video demonstrates the extensive RF signal generator functionality available in the tinySA Ultra.
Tomi Engdahl says:
#1325 TinySA ULTRA Spectrum Analyzer (a first look)
https://www.youtube.com/watch?v=0ELGDz3ibNg
Episode 1325
New $120 spectrum analyzer 4″ screen
100kHz to 800MHz frequency range and up to 6GHz in ULTRA mode
200Hz min. resolution bandwidth
Tomi Engdahl says:
tinySA Ultra Very amateur tests from 1 to 5G using a simple signal generator
https://www.youtube.com/watch?v=xm9RsNyVMwA
Simple 1-5G test of tinySA4 using signal generator, as they are DIY works. No definite meaning, just for reference.
Tomi Engdahl says:
#1325a TinySA ULTRA Spectrum Analyzer 6GHz ‘Ultra Mode’
https://www.youtube.com/watch?v=djhrmAFfPns
I try the ultra mode to allow frequencies up to 6GHz. Be careful as there are signal output on the TinySA input port.
Tomi Engdahl says:
#1325b TinySA ULTRA Spectrum Analyzer Teardown
https://www.youtube.com/watch?v=EGRvL2gy21I
A quick look inside the new TinySA ULTRA
Tomi Engdahl says:
tinySA Ultra Low Frequency performance
https://www.youtube.com/watch?v=cSuj8E77lz0
Short video demonstrating what impacts the below 1MHz performance of the tinySA Ultra and what you can do to get the best performance with low level signals.
Tomi Engdahl says:
https://www.signalintegrityjournal.com/blogs/17-practical-emc/post/2613-choosing-an-affordable-spectrum-analyzer
Tomi Engdahl says:
Say The Magic Word, And The TinySA Goes Ultra
https://hackaday.com/2022/12/17/say-the-magic-word-and-the-tinysa-goes-ultra/
We’ve looked at the TinySA spectrum analyzer in the past. However, the recent Ultra edition offers an increase in range from 800 MHz to 6 GHz. How does it work? [IMSAI Guy] tells us in a recent video
For some reason, you have to put a passcode in to enable the Ultra mode, although the passcode appears to be common knowledge and available on the device’s wiki. You can presume they could, at some point, make this feature or others require a paid passcode, but for now, it is just a minor inconvenience.
#1325a TinySA ULTRA Spectrum Analyzer 6GHz ‘Ultra Mode’
https://www.youtube.com/watch?v=djhrmAFfPns
Tomi Engdahl says:
https://eleshop.eu/tinysa-ultra-spectrum-analyser.html
Tomi Engdahl says:
https://www.rtl-sdr.com/tinysa-ultra-reviews-a-0-1-mhz-6-ghz-spectrum-analyzer-for-120/
Tomi Engdahl says:
tinySA Ultra Spectrum Analyzer Review/Experiments/Teardown
https://www.youtube.com/watch?v=ypqJMcVC-z8
In this video, I reviewed a tinySA Ultra spectrum analyzer. The SA is capable of observing signals up to 12 GHz which is very impressive considering the price. It also has a built-in RF synthesizer that can output signals up to 5.4 GHz, and supports AM/FM and sweep. Later in the video, I did a teardown and some further analysis. Product link: https://ban.ggood.vip/13Qo1 Coupon code: BG93a5f8 exp: 6/30/2023
00:00 Overview
02:51 Default/ultra mode, lower band calibration
05:35 100MHz, 800MHz and sweep test signals, AM/FM
11:49 Waterfall display, AM/FM demodulation
14:29 5.34 GHz calibration, 2 to 6GHz test signals with HP 8671A
19:27 7 to 11GHz test signals with Wavetek 907
21:29 TinySA as a RF synthesizer, up to 5.4 GHz
24:38 Teardown and conclusions
Tomi Engdahl says:
http://www.kerrywong.com/2023/06/16/tinysa-ultra-teardown-pictures/
Tomi Engdahl says:
https://www.banggood.com/2023-New-Handheld-4-inch-Display-Tiny-Spectrum-Analyzer-TinySA-ULTRA-100kHz-to-5_3GHz-with-32GB-Card-Version-V0_4_5_1-p-1986449.html?imageAb=1&utm_campaign=20491430_216385_1986449_Youtube&utm_content=12202&p=ZK021720491430201804&akmClientCountry=FI&cur_warehouse=CN
Tomi Engdahl says:
http://pakahuszar.blogspot.com/2023/06/spectrum-analyzer.html
Tomi Engdahl says:
With a mixer and a 977MHz signal source, this pocket-sized spectrum analyzer can take on scalar network analyzer duties.
Kerry D. Wong’s Simple Tracking Generator Add-On Unlocks a New Feature in the TinySA Ultra
https://www.hackster.io/news/kerry-d-wong-s-simple-tracking-generator-add-on-unlocks-a-new-feature-in-the-tinysa-ultra-b91f8e78d870?fbclid=IwAR2jBm9o0oe3TaGQN6LGZPbleSB12GsHZ2Out1puucyWkFTG7xVD4B84qlM
With a mixer and a 977MHz signal source, this pocket-sized spectrum analyzer can take on scalar network analyzer (SNA) duties.
Engineer Kerry D. Wong has added a new feature to the tinySA Ultra pocket-friendly spectrum analyzer: a tracking generator, designed to aid frequency response measurement.
“[A] Tracking generator is useful for determining the frequency response of filters. Without a tracking generator, the frequency sweep across the device under test (DUT) is independent of that of the spectrum analyzer,” Wong explains.
A scalar or vector network analyzer (SNA or VNA) offers its own tracking generator for fixing this problem, but the tinySA Ultra — for all its other features as what Wong calls “quite a capable spectrum analyzer” — lacks such a feature. That’s where Wong’s add-on comes in. “Basically, to add a tracking generator, all you need is an external mixer and a 977MHz signal source,” Wong explains.
“LO output is enabled on the tinySA Ultra and the LO [Local Oscillator] signal is outputted from the CAL port. The LO’s signal is connected to the LO port on the mixer,” Wong continues. “The RF port on the mixer is connected to the 8642B RF signal generator which is outputting a 977MHz 0dBm signal. Finally the DUT is connected between the IF port of the mixer and the RF port of the tinySA Ultra.”
While the result isn’t perfect — “it is actually pretty difficult to find a suitable passive mixer for this tinySA Ultra,” Wong admits — the resulting add-on gives the device a new capability,
Making A Tracking Generator For The TinySA Ultra Spectrum Analyzer
http://www.kerrywong.com/2023/07/08/making-a-tracking-generator-for-the-tinysa-ultra-spectrum-analyzer/
Tomi Engdahl says:
TinySA Counterfeit Warning
https://www.youtube.com/watch?v=tiBZLBwmyJc
This is my experience in buying what turned out to be a counterfeit product via AliExpress and attempting to prove that the device is fake to AliExpress.
Hopefully if one person looks at this and avoids buying one of the fakes then it will have been worth the effort. Some might say that you deserve what you get buying from Ali but the point here is that the counterfeit units are useless for any kind of measurements!
Tomi Engdahl says:
tinySA observing WiFi and DECT
https://www.youtube.com/watch?v=Oo-oHaO9ang
Short video demonstrating how you can using two tinySA and a mixer to observe WiFi and DECT signals
Tomi Engdahl says:
tinySA Ultra observing WiFi and other networks
https://www.youtube.com/watch?v=4c4oNJRnPrc
Tomi Engdahl says:
tinySA Ultra and its LNA
https://www.youtube.com/watch?v=iOOeNR_GN88
Tomi Engdahl says:
tiny SA How to find Crystal Oscillator Frequency
https://www.youtube.com/watch?v=KO22DWqChyQ
Using tiny SA RF spectrum analyzer to determine the resonance frequency of Crystal Oscillator. In this experiment the tiny SA calibration output frequency of 1 MHz is used to make the crystal resonate, and the “low” input of the tiny SA. 3 MHz does work also but 1 MHz works better, even frequency numbers weren’t much of a help in this test, unusable.
Tomi Engdahl says:
Tracking Generator for tinySA
the need for this project was born to be able to visualize the curve of a 40 MHz filter with greater dynamics than the nanovna and also speed up the calibration of the filters in real time, there are no waiting times for each adjustment of a compensator or a nucleus.
In fig.1 the block diagram. fig. 2 loop output 1MHz -200 MHz.
Conclusion
The project performs its task adequately, the output signal is clean without spurious. The cost of this tracking is also low, we are at the level of a pizza. Furthermore there is no alternative, there is no tracking on the market for this small spectrum analyzer.
Due to copyright issues it is not possible to make it public until the project is published on QEX.
translated with Google
73 of I4BBO [Valentino Barbi](https://www.facebook.com/groups/2715786312037088/user/100082291094780/?__cft__0=AZXc6WCHWDgN-RKizecSKABf5VeuRt1d4RF1srZQy72RRFS5qkkDjXAP1BXO-3xVPf10DS41GD5sPp9sZLL82UeDBYIMQ_6Mhej0BapFmIGz7Zs4-LqsxYgjW3uyGbuT9PVrmgypgjUUpavhL56Vn9pIPsgxz1vj901Gin8PUM4BVcXsDRzGUDgcwQ_ZWV7MOkNFJvJCrCUw3USDkgcZsQ1C&__tn__=-K-R)
Tomi Engdahl says:
https://www.facebook.com/share/p/2acEUmeTWGDvHffm/