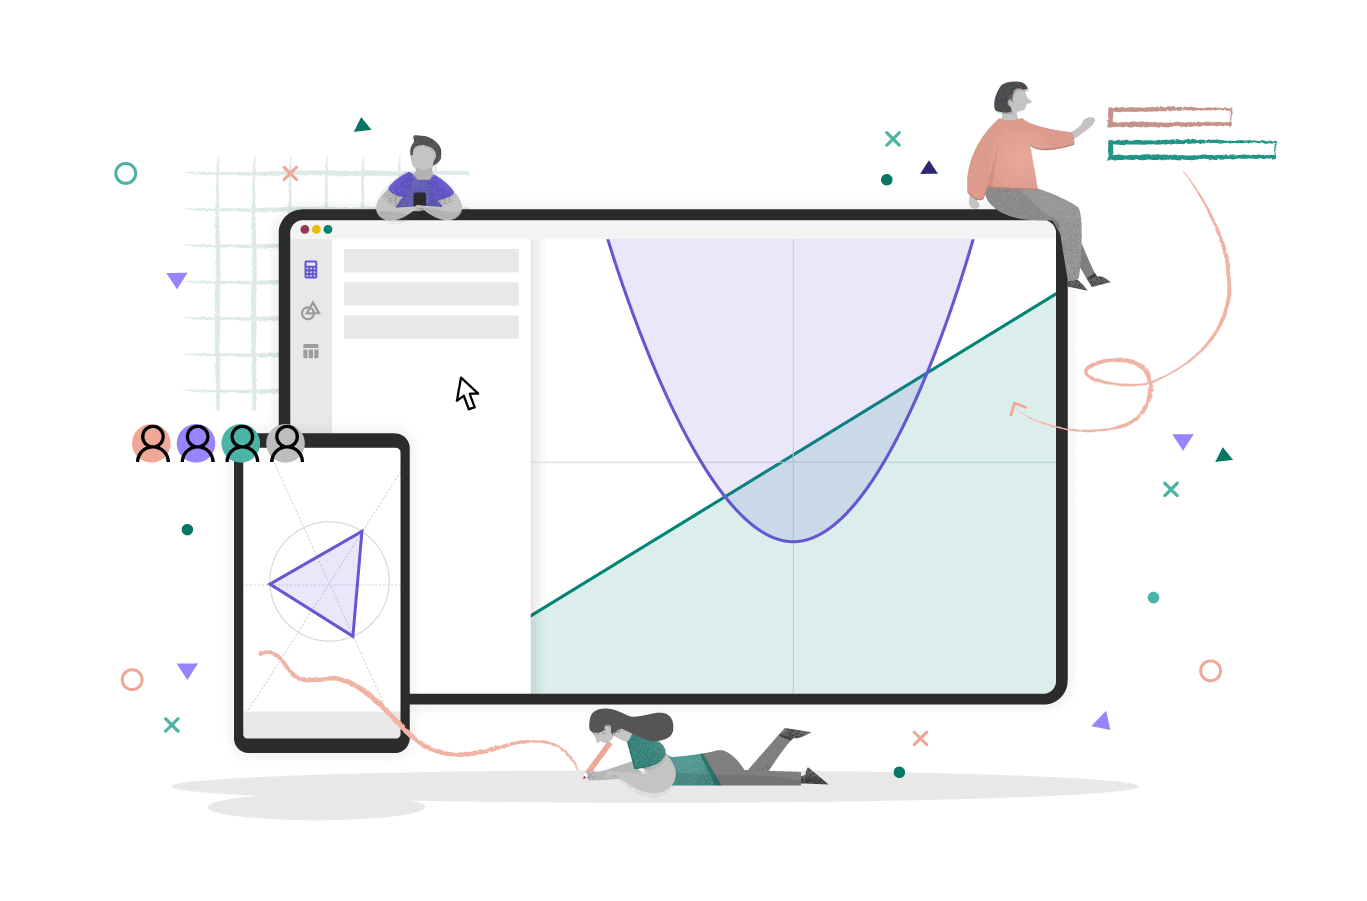
GeoGebra (a portmanteau of geometry and algebra) is an interactive geometry, algebra, statistics and calculus application, intended for learning and teaching mathematics and science from primary school to university level. It is nice that it works on your browser without installation using multiple languages including Finnish. That’s the way I tested it by going to https://www.geogebra.org/ and https://www.geogebra.org/calculator
Constructions can be made with points, vectors, segments, lines, polygons, conic sections, inequalities, implicit polynomials and functions, all of which can be edited dynamically later. Elements can be entered and modified using mouse and touch controls, or through an input bar. GeoGebra can store variables for numbers, vectors and points, calculate derivatives and integrals of functions, and has a full complement of commands like Root or Extremum. Teachers and students can use GeoGebra as an aid in formulating and proving geometric conjectures. Anyone can use it when they need mathematics software occasionally and don’t want to install any software.
GeoGebra’s main features are:
Interactive geometry environment (2D and 3D)
Built-in spreadsheet
Built-in computer algebra system (CAS)
Built-in statistics and calculus tools
Scripting hooks
Large number of interactive learning and teaching resources at GeoGebra Materials.[8]
GeoGebra‘s source code is licensed under the GNU General Public License (GPL) and all other non-software components are under Creative Commons BY-NC-SA. GeoGebra is available on multiple platforms, with apps for desktops (Windows, macOS and Linux), tablets (Android, iPad and Windows) and web. Commercial use is subject to a special license and collaboration agreement.

7 Comments
Tomi Engdahl says:
Sliders
https://www.geogebra.org/m/KZDm6QEs
Tomi Engdahl says:
Time series data
https://www.geogebra.org/m/vuq5esx5
Tomi Engdahl says:
Plotting and fitting data in Geogebra
https://www.youtube.com/watch?v=aeV1gjd2o-U
This screencast shows how to enter data into the Geogebra spreadsheet view, make a scatter plot, find a curve of best fit, and then import the model back into the graphics view for further analysis.
Tomi Engdahl says:
https://www.geogebra.org/calculator
Sliders in GeoGebra
https://www.geogebra.org/m/KZDm6QEs
Tomi Engdahl says:
Time Series Graph
https://www.geogebra.org/m/vuq5esx5
Tomi Engdahl says:
Your Engineering Pad In Browser
https://hackaday.com/2023/05/29/your-engineering-pad-in-browser/
These days, you tend to sketch math functions on the computer and there are plenty of people willing to take your money for the software. But if you fire up your browser, head over to EngineeringPaper.xyz and you might save a little cash.
Although it looks a lot like a Jupyter notebook, the math cells in EngineeringPaper keeps track of units for you and allows you to query results easily. Want to read more? Luckily, there is an EngineeringPaper worksheet that explains how to use it. If you prefer your explanations in video form, check out their channel, including the video that appears below.
https://engineeringpaper.xyz/
https://engineeringpaper.xyz/CUsUSuwHkHzNyButyCHEng
Tomi Engdahl says:
KE5: Reaktion keskimääräinen ja hetkellinen muutosnopeus
https://www.geogebra.org/m/p5cqmjkz